
By Marcelo Cicconet and Kris Gunsalus
at the NYU Center for Genomics and Systems Biology
|
|
|
|
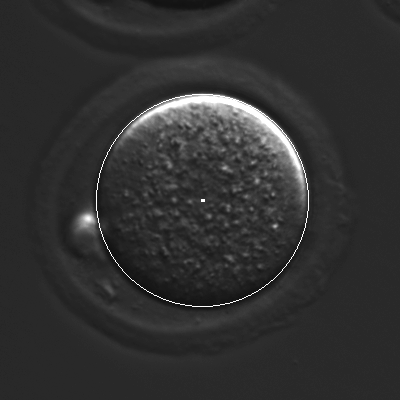
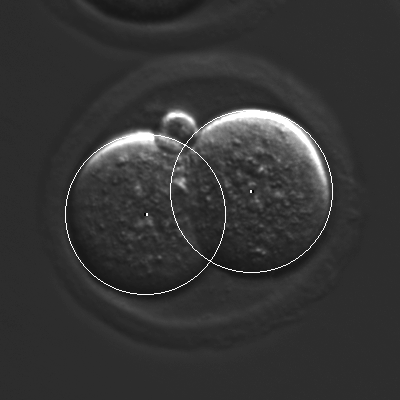
The database contains, for each of the 100 examples: (1) the uncompressed frames, up to the 10th frame after the appearance of the 8th cell; (2) a text file with the trajectories of all the cells, from appearance to division (for cells of generations 1 to 3), where a trajectory is a sequence of pairs (center, radius); (3) a movie file showing the trajectories of the cells.
Database: MouEmbTrkDtb.zip [3.58 GB]
Sample movie: Video.avi [5.3 MB]
Matlab script for parsing trajectories files: parse.m [1 KB]
CellTracker -- binary file (runs on Mac OS 10.9) of demo software* used to build the database: CellTracker.zip [58 KB]
Source code (Objective-C, Xcode project) of software used to build the database: link to Bitbucket.
Corresponding paper: link to ScienceDirect.
Extra -- derived databases for cell counting, with and withoug overlap: MouEmbTrkDtbCount.zip [113.3 MB]
A Few Results
The main goal of CellTracker is to capture time information related to the lineage tree of each embryo (rather than simply the times when cell-division events occur).
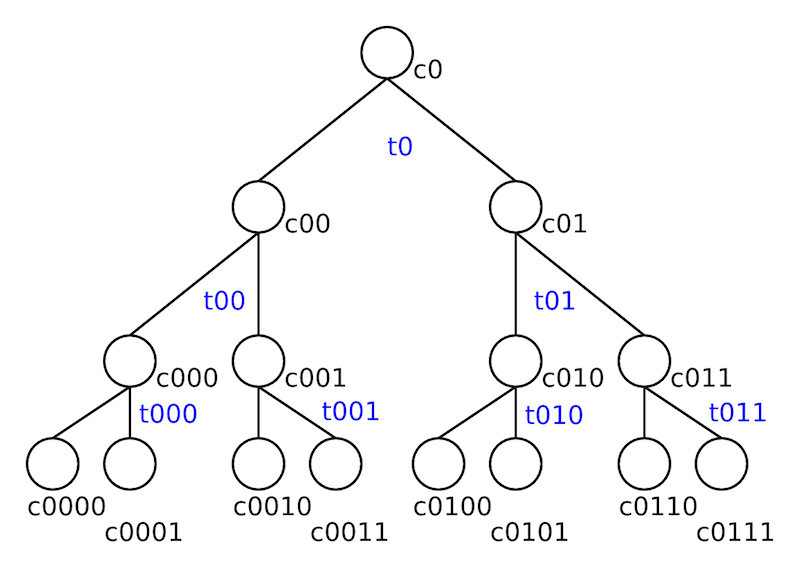
This allows gathering statistics of cell-duration for different generations of cells, as well as measuring synchronicity of cell divisions for cells that are "siblings."
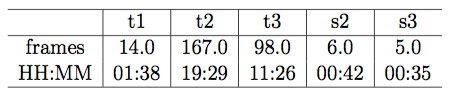
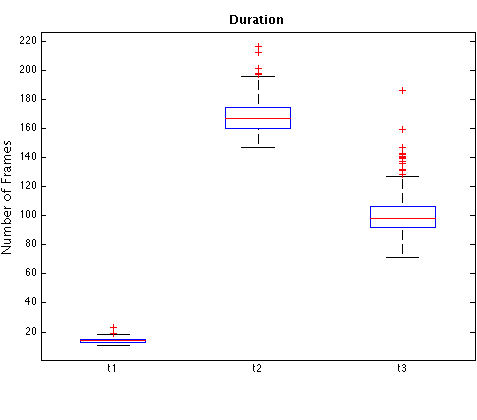
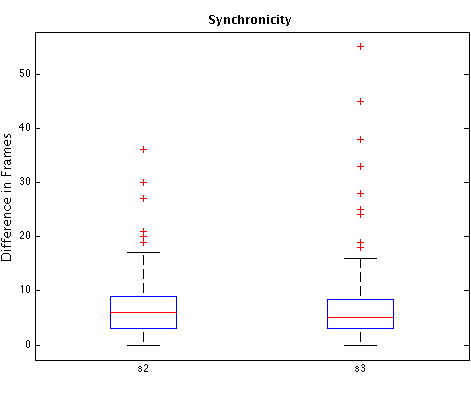
The following table shows the medians of timing measurements, in frames and hours:minutes, obtained from a subset of 92 embryos in the cell tracking database (those embryos for which pronuclear envelope breakdown was clearly visible). t1, t2, t3: durations of 1st, 2nd, and 3rd generation cells, respectively. s2: absolute difference, in frames, between times in which sibling cells of 2nd-generation divide (the "s" if for "synchronicity"). s3: analogous of s2 for 3rd-generation cells. All examples go to 8-cell stage.
Next are box plots of measurements described in the previous table. To convert the vertical axis in clock time, use the fact that consecutive frames are 7 minutes apart. Horizontal red lines inside boxes represent the median. Bottom and top box edges are the 25th and 75th percentiles, respectively. Whiskers represent the most extreme points considered not to be outliers, and outliers are plotted individually ("plus" signs). Results were computed using Matlab's boxplot function.
|
|
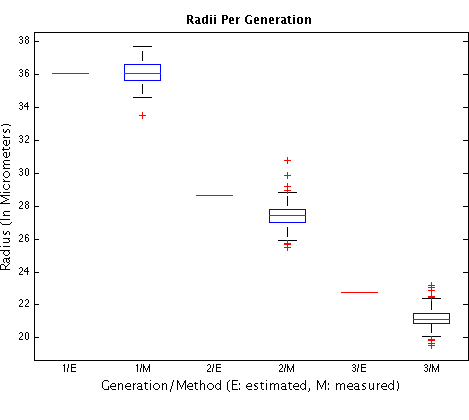
The following plot approaches the question of there being conservation of total volume up to the 8-cell stage. 2nd and 3rd red line segments (not within blue boxes): radii of 2nd and 3rd generation cells, based on the median 1st generation radius as measured by CellTracker (1st red line segment), supposing conservation of total volume and sphere-shaped cells. The remaining columns are the box plots of estimated radii for different generations as computed using CellTracker. Using the medians as estimators of radii, the total volume is actually reduced up to the 8-cell stage: in 88% from 1st to 2nd generation and in 92% from 2nd to 3rd generation. The conservation of volume predicts a radius that is off by 4.5% for 2nd-generation cells and by 7.6% for 3rd generation cells. The estimated medians correspond to radii of approximately 27.41μm for a 2nd-generation cell, and of 21.14μm for a third generation cell. We normalized the plot so that the median for 1st-generation cells is 36.09μm (this value is the median of the radii of 59 1st-generation cells of distinct non-injected embryos, measured using the NIS-Elements imaging software).
Please cite the reference below if you use the database, and feel free to let us know of your potential findings (we would be happy to announce and link them here if requested). For questions, contact Marcelo: mc4527 [at] nyu [dot] edu
BibTeX:
@article{Cicconet2014,
  author  = {Marcelo Cicconet and Michelle Gutwein
             and Kristin C Gunsalus and Davi Geiger},
  title   = {Label Free Cell-Tracking and Division Detection
             Based on 2D Time-Lapse Images
             For Lineage Analysis of Early Embryo Development},
  journal = {Computers in Biology and Medicine},
  year    = {1 August 2014},
  volume  = {51},
  pages   = {24-34}
}
(*) This demo software is provided for research purposes only. A license must be obtained from New York University for any commercial applications. The software was implemented to run natively on Apple Macintosh computers only.
This work was supported in part by NSF grant 1422021 (Program: Robust Intelligence), and NIH grants R01-GM085503 and R01-HD046236.
Last update: May 29, 2015.